TGO TGO
|
| Auroral zone activity last month. |
|
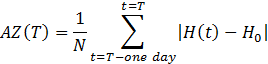
This figure tells the geomagnetic activity as observed from Tromsø (in the auroral zone) during the last 33 days.
As a measure of activity we have used an index describing the average deviation of the horizontal field
component from its normal value. In mathematical terms the calculation is:
Here H(t) is a time series of N = 1440 one minute values of the horizontal component covering the 24 hours
before the time T of calculation. H0 is taken as the average of H for the same period. |
| 17 August 2011, Truls Lynne Hansen |